Workforce Heat Maps
Tracking Workforce Density with AI-Powered Heat Maps for Industrial Worksites
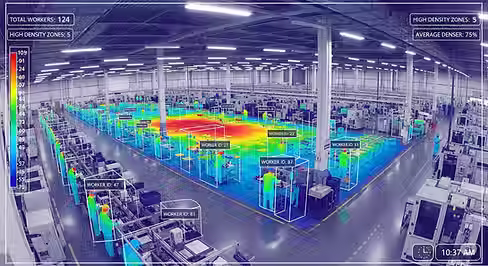
Transforming ordinary CCTV into intelligent insight, viAct video analytics powered heat maps track workforce flow, detect crowding patterns, manage workforce congestion, and reveal density hotspots; empowering operational teams to plan smarter, deploy efficiently, and ensure safety across complex sites like construction zones, factories, and shipyards.

Workforce Heat Map is a computer vision-enabled solution that transforms existing CCTV infrastructure into a powerful spatial intelligence tool. Leveraging AI-based object detection and movement tracking, the system maps worker trajectories in real-time to visualize density patterns, bottlenecks, and idle zones. These dynamic visualizations offer deep insights into workforce movement, helping teams proactively manage workforce distribution, reduce congestion, and plan resources more effectively.
Powered by viAct proprietary video analytics engine, the solution uses deep learning algorithms to identify and track individual worker motion without GPS or wearables. The heat maps are generated through pixel-level analysis of time-spatial data, enabling high-accuracy monitoring while preserving worker privacy. Unlike manual counting or RFID-based tracking, this AI-driven system provides non-intrusive, scalable insights into daily operations.
With seamless integration, real-time dashboards, and automated reporting, viAct Workforce Heat Map equips EHS and operations teams with actionable data to improve site safety, boost operational efficiency, and ensure regulatory compliance—especially in complex, high-risk work environments.
What makes Workforce Heatmap an essential for Complex Jobsites?
Worker misallocation and overcrowding are invisible yet critical risks across high-risk industries such as construction, oil & gas, logistics, shipyards, and manufacturing. It’s not merely a matter of headcount but of where, when, and how workers are positioned; especially in dynamic sites with evolving activities and limited oversight.
Common workforce distribution lapses include:
● Overcrowding in confined or high-risk work zones
● Understaffing in hazardous or isolated areas
● Unauthorized presence in restricted or safety-critical zones
● Workers loitering or idling during shift transitions
● Delay in reallocating workforce after task completion
● Supervisors lacking real-time visibility on worker clustering
● Missed insights on workforce movement during emergencies
● Cross-trade interference in shared work areas like lifts or corridors
● Task lag due to crew stationed far from material/equipment zones
● Accidental safety breaches due to high-density blind spots
What starts as misplacement of a few workers can result in lowered productivity, bottlenecks, or even critical safety breaches.
Even with SOPs, access logs, and walkie-talkies, EHS teams often fail to grasp the full picture of workforce movement across fast-paced, large-scale job sites. This is where CCTV-enabled, AI-powered Workforce Heatmap steps in. By converting video feeds into real-time density maps and movement trails, it empowers supervisors to manage workforce allocation proactively, spotting idle clusters, overcrowded areas, or risky dispersals before they lead to delays or accidents.
Who Needs Workforce Heat Maps the Most?
Worker movement data is critical wherever labor-intensive operations meet complex layouts. In environments where precision planning drives performance, heat maps enable data-backed decisions on manpower allocation, shift timing, and spatial design.
Warehouse & Storage Hubs with Traffic Flow
Warehouses, packaging plants, and cold storage units deal with constant inbound-outbound movement. Congestion in loading bays or sorting zones can cause delays or safety issues. Workforce Heat Maps monitor flow density in real time, allowing logistics teams to adjust routing, staffing, and schedules.
Shipyards & Heavy Engineering Sites with Spatial Disparities
Vast industrial setups like shipyards or fabrication yards involve large workforces operating across multiple decks or compartments, making manual Tracking nearly impossible, thus heat mapping system visualizes spatial spread, highlights clustering, and supports safe distancing, empowering managers with data-driven control.
Construction Zones with Dynamic Crew Movement
Large-scale construction sites often have constantly changing teams working across different floors and zones, leading to congestion, inefficient deployment, and safety risks. viAct Workforce Heat Map provides instant crowding alerts, enabling teams to optimize manpower distribution and ensure safer site navigation.
Manufacturing Floors with Large Complex Layouts
In manufacturing plants and assembly lines, even slight inefficiencies in worker movement can impact productivity and output. The Workforce Heat Map tracks real-time worker flow across stations, revealing layout inefficiencies and underutilized zones, helping supervisors rebalance labor, streamline operations, and enhance overall workflow.
Mining & Oil Sites with Red Zones
Remote and hazardous sites like mines or oil refineries require precise control over worker proximity to critical assets. viAct AI-powered heat maps detect real-time crowding near red zones, helping EHS teams manage exposure risks, plan shifts smarter, and enforce zoning protocols to avoid incidents.
Who Needs Workforce Heat Maps the Most?
1
Choose
Operations or safety teams begin by selecting the “Workforce Heat Map” AI module from viAct viHUB, part of its 200+ AI video analytics solutions. This module is designed to visualize real-time worker movement and density patterns across complex, labor-intensive sites.

2
Connect
The selected AI module integrates effortlessly with existing camera infrastructure (whether IP cameras, AI CCTV, or cloud-connected RTSP streams); eliminating the need for additional hardware, GPS devices, or wearable trackers.
3
Capture
Once activated, the AI continuously processes live video feeds to generate dynamic heat maps of workforce activity. It uses computer vision to detect:
● Areas of high worker congestion or crowding
● Zones with little or no activity
● Repetitive, inefficient movement patterns across shift cycles
● Changes in worker flow during shift transitions or task reassignments
4
Control
Heat map data is visualized on a centralized dashboard with real-time zone indicators, trend analytics, and site-wise scorecards. Supervisors receive actionable insights to rebalance labor, decongest zones, and improve planning. Trend reports and safety scores support workflow optimization, compliance, and data-driven decisions across multiple project sites.
Case Study: GCC Energy Leader Cuts 90% Unwanted Crowding near Red Zones with viAct Workforce Heatmap
Industry :
Oil & Gas
Location :
GCC
Module :
Workforce Heatmap Module
The Problem:
An Oil & Gas giant in the GCC struggled with repeated crowding near high-risk Red Zones like rotary tables, BOP stacks, and choke manifolds, especially during tool changes, inspections, and shift overlaps. These congested conditions, exacerbated by poor visibility and high ambient noise, posed severe collision and crush risks, violating HSE norms and endangering frontline workers and support crews.
The Solution:
To manage crowding near Red Zones, the firm deployed viAct AI-powered Workforce Heatmap Module. Using existing cameras, it visualized worker movement in real time, flagged congestion risks, and enabled supervisors to intervene early; improving safety, compliance, and monitoring accuracy.
The viAct impAct:
● Within the first three months, the operator reported a 90% drop in Red Zone intrusions and zero critical incidents in monitored zones.
● Under the red zone monitoring system, workforce heatmaps support compliance with GCC HSE mandates and internal “Permit to Work” (PTW) protocols by providing timestamped reports, breach patterns, and audit-ready video logs.

Why Choose viAct Workforce Heatmaps Over Manual Spotter Surveillance?
Beyond static monitoring, viAct heatmaps empower supervisors with predictive insights and spatial intelligence to prevent incidents before they occur.
01
Eliminates 80% of manual errors in workforce placement by using real-time density tracking to maintain zone-specific headcount compliance.
02
52% reduction in crowding with AI heatmaps flagging unsafe density near cranes zones before breaches.
03
Reduces congestion during shift transitions overlaps by 10x through historical heatmap patterns, optimizing crew entry-exit flow across tightly scheduled tasks.
04
Cuts congestion at high-traffic bottlenecks (stairwells, narrow corridors) by identifying movement spikes and prompting staggered crews’ dispatch.
05
3x faster root cause analysis via spatial replay of incidents, helping visualize how crowding or unsafe clustering escalated near-miss events.
06
Prevents mismatch of worker vs task zones by flagging when labor density deviates from planned schedules.
07
Improves crew output forecasting by correlating zone-wise workforce spread with actual daily KPIs, allowing better resource planning and zone loading.